Building a Live Ham Radio Situational Awareness Dashboard
By Robby McCullough · Published April 1, 2026
The specific thing I wanted was a screen I could leave on in the background that showed me what was happening outside without me having to go find it. Local radar. Fire cameras. What's on 101. Whether there's a ship moving through the Bay. What the Kp index is doing. All of it, cycling on its own, no interaction required.
Ham radio people call this situational awareness. I call it wanting to know if Petaluma is on fire before I hear the sirens.
So I built it. It's at mybbor.com/ham-dashboard.html and it runs on a TV in my house.
How it works
I started with an open-source framework called hamdash (VA3HDL), which handles the grid layout, tile rotation, and config loading. You give it a config.json with a list of image URLs and iframe sources, it arranges them in a grid and auto-refreshes on a timer. Clean starting point.
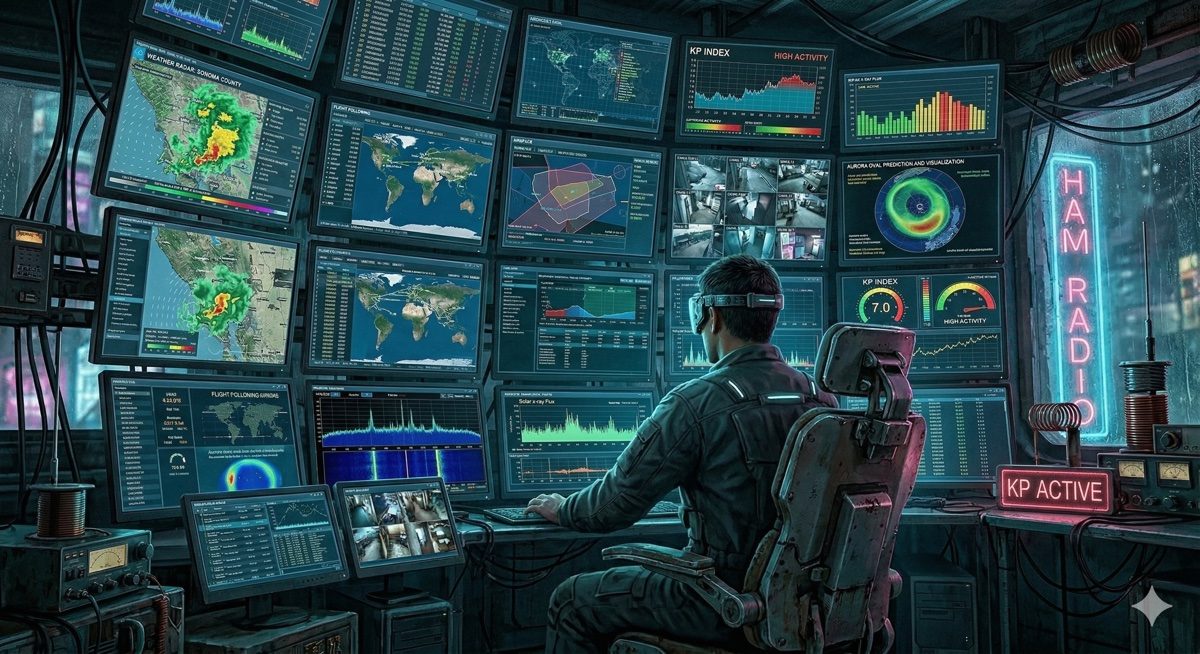
The grid started as 4×5 — 20 tiles. Spent the first hour cutting things that didn't actually work: FT8 propagation was a broken embed, tides had a dead data source, solar conditions was redundant. Ended up at 4×4, 16 tiles. GOES-18 satellite imagery, KMUX radar loop, AlertCalifornia fire camera, ISS position, APRS stations, CalFire incidents, SF Bay marine traffic, highway cameras, aurora forecast, space weather. Everything auto-refreshing. Nothing requiring a click.
The parts that fought back
APRS. I wanted live station positions within 80km of Petaluma plotted on a dark Leaflet map. The aprs.fi API blocks direct browser fetch calls — no CORS headers — so I routed it through corsproxy.io. Got it working, then hit a wall: the API kept returning "loc query: no search term specified" no matter what coordinates I passed. Turns out their what=loc endpoint requires a name= parameter. Geographic radius queries aren't enough on their own. Adding name=* as a wildcard fixed it. That one took a while to find.
Drag and drop. The framework lets you rearrange tiles, which is great. But image tiles couldn't be dragged — the browser's native image-drag was intercepting the mousedown before the drag handler could fire. The fix was keeping a transparent overlay div visible on image tiles, same as iframes. Also had a flickering drag-highlight bug caused by dragleave firing when the cursor moved over child elements. Needed a relatedTarget check to filter those out. Small stuff, but it took a few passes.
The moon. Dropped the moon phase tile from the grid to save space, but still wanted the data in the header. Wrote a small SVG renderer that draws the lit portion using two arcs — one for the limb, one for the terminator. The arc sweep directions have to be right for all four phase cases or the shapes cancel each other out under the SVG fill rules. Found this out when a full moon rendered as a dark circle. fill-rule="evenodd" plus careful sweep flags fixed it.
The TV. Plugged the dashboard into an LG TV and the flight traffic tile just spun. Turned out the tile was using a 3D globe renderer that requires WebGL, and the LG's browser doesn't have it. Tried switching to Flightradar24 — they block iframe embedding entirely. So do Radarbox and Planefinder. Ended up back on ADS-B Exchange, which at least works on every normal browser. The TV is a known limitation for now.
What I'd tell myself at the start
Check iframe embedding headers before you build around a data source. One curl -sI <url> | grep -i x-frame would have saved me the Flightradar24 detour. Same with CORS — know upfront whether you'll need a proxy, because it changes how you structure the fetch logic.
And test on the actual display. The WebGL thing was invisible in Chrome on a laptop.
The dashboard is live. It does the thing I wanted it to do. Now I just have to find a flight tracker that lets you embed it.
KN6KVS — Petaluma, CA